
Mrs. Dow Jones User Research
Mrs. Dow Jones User Research


User Research Initiative
Duration: 4 Weeks
Role: End-to-End User Research Lead
Tools Used: Zoom for interviews, Google Sheets for data collection, FigJam for affinity mapping, Google Analytics for site metrics, Instagram Polls for quantitative insights
“We want to drive signups to our free financial tools so we can grow our newsletter. Once there, we know we Can create the know/like/trust necessary to sell our larger offerings and increase our revenue.”


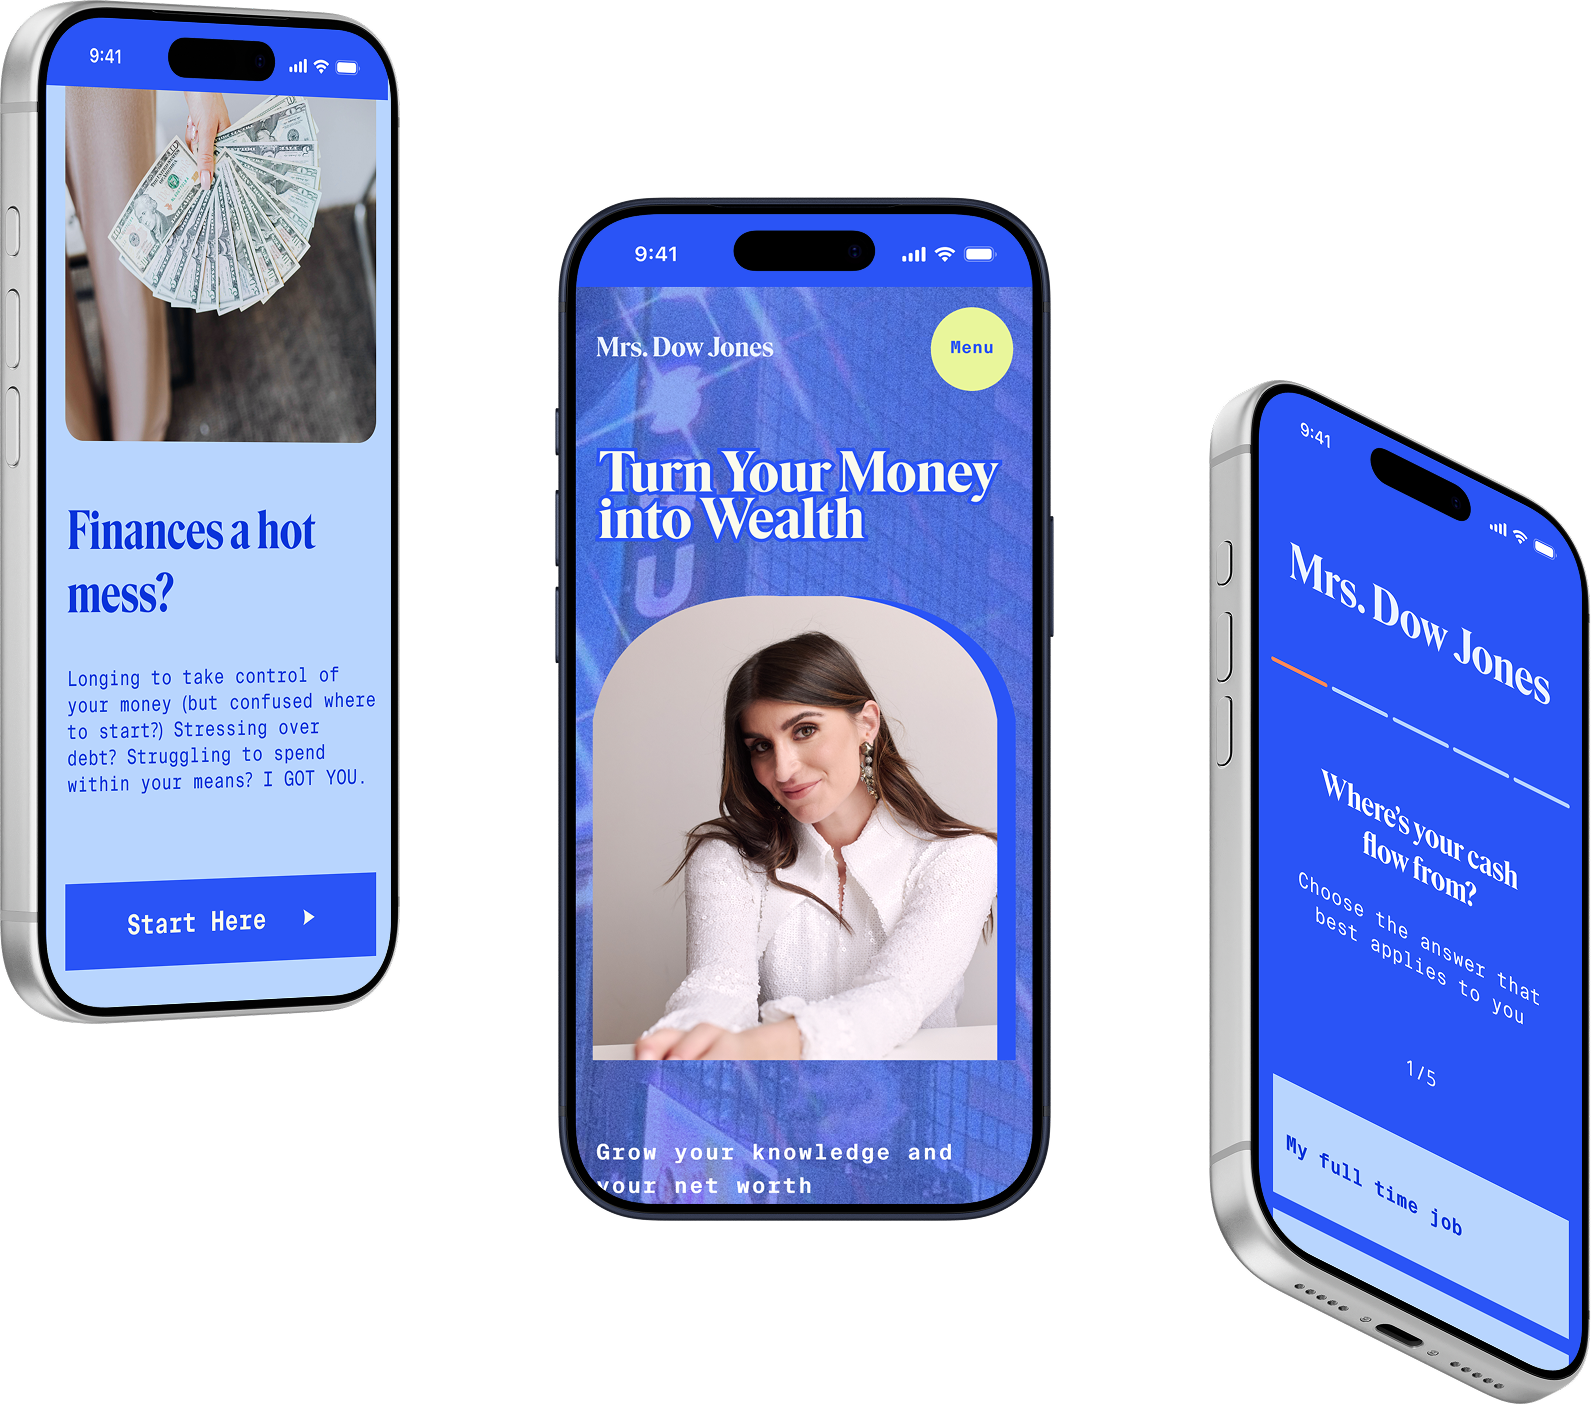
Finance is Cool, is a financial education platform by Mrs. Dow Jones, focused on empowering women with relatable, humorous content on investing, budgeting, debt payoff, and generational wealth. The platform excels on social media but faced challenges with website engagement. Analytics revealed a 94% dropoff rate after the homepage, indicating navigation issues and content misalignment with user needs. The founder aimed to increase newsletter signups by leveraging high-value tools and calculators, while refocusing the site on audience priorities.
Problem Statement
MDJ's website attempted to cover a broad range of financial topics, leading to information overload and poor user flow. Key issues included:
High homepage dropoff (94%), suggesting confusing navigation.
Low utilization of tools like calculators and guides, despite their potential value.
A competitive analysis of platforms like Her First 100k highlighted best practices: user-friendly layouts, dedicated resource pages, and clear user journeys. This informed our hypothesis that streamlining the site around top user interests (e.g., investing) would improve engagement.
Mismatch between social media appeal (relatable, fun content) and site experience (generic, unfocused).
Untapped opportunities for newsletter growth through gated resources.

Introducing: the new Mrs. Dow Jones

This project involved comprehensive user research to inform a website redesign, emphasizing user-centered navigation, personalized content, and optimized calls-to-action (CTAs). The outcome was a strategy to boost retention, signups, and overall user satisfaction.
Research Journey
Insight Goals
Identify user motivations, financial goals, literacy levels, and pain points.
Evaluate content preferences, including most/least useful topics and site interactions.
Quantify interest in specific tools to prioritize for newsletter gating.
Uncover opportunities for personalization, new features, and navigation improvements.
Validate redesign ideas through competitive insights and audience polling.
Methodology
A mixed-methods approach combined qualitative and quantitative data for robust insights.
Qualitative Research:
Interviews: Conducted 22 semi-structured, 30-minute Zoom interviews with active Instagram followers recruited via story posts. Questions explored financial backgrounds, MDJ perceptions, content value, and site usage. Participants received a $40 Amazon gift card. Data was logged in Google Sheets and analyzed via thematic coding in Miro (affinity diagramming).
Ethical Considerations: Informed consent, anonymity (pseudonyms), and focus on diverse representation (age, location, literacy).
Quantitative Research:
Website Analytics: Reviewed Google Analytics to confirm dropoff rates and identify underused pages.
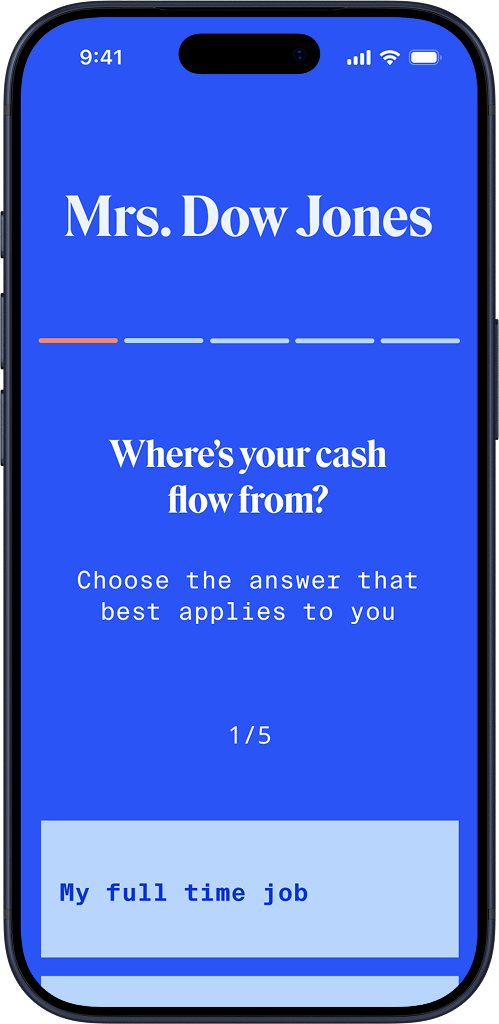
Social Polls: Polled over 200,000 followers on Instagram. Key questions: "How good are you with money?" (77% responded "good"); "Top finance category (out of 8)?" (35% investing); "Favorite freebies?" (52% Free Index Funds List, 29% Generational Wealth Hack Guide).
Competitive Analysis: Benchmarked 5 competitors (e.g., Her First 100k) on layout, CTAs, and resource organization.
Participant Demographics:
22 interviewees (from ~45 sign-ups; some no-shows).
Predominantly women, ages 25-39 (average ~32).
Locations: Mostly US (e.g., Colorado, Miami, Texas, DC), one international (Hong Kong).
Professions: Diverse (e.g., marketing, finance, law, tech, education).
Financial Literacy: Beginner (~30%), Mid-tier (~50%), Advanced (~20%).
Time Following MDJ: 1 month to 6+ years (average 1-2 years).

Key Findings
User Motivations and Content Preferences:
Followers value MDJ's relatable, women-focused style: "Humorous," "trustworthy," "not salesy" (e.g., pop culture references differentiate from "patronizing" competitors).
Top Jobs: Investing confidence and basics (20/22 mentions), retirement planning, generational wealth security, budgeting automation.
Most Useful: Index funds/ETFs (6x), HYSA (5x), IRA tips (4x), budgeting tools (3x).
Least Useful: Kid-related (e.g., 529 plans if no kids), high-earner content, US-specific taxes (international users).

Financial Journeys:
Wins: Debt payoffs (e.g., 10k credit card debt), account openings (brokerage/HYSA), investments (e.g., IPO gains).
Struggles: Debt burdens (7x), scarcity mindsets (4x), unpredictable income, feeling "behind" peers.
Quotes: "Haley makes it seem less overwhelming" (Amanda); "Quizzes/calculators are unique" (Elise).

Site and Tool Interactions:
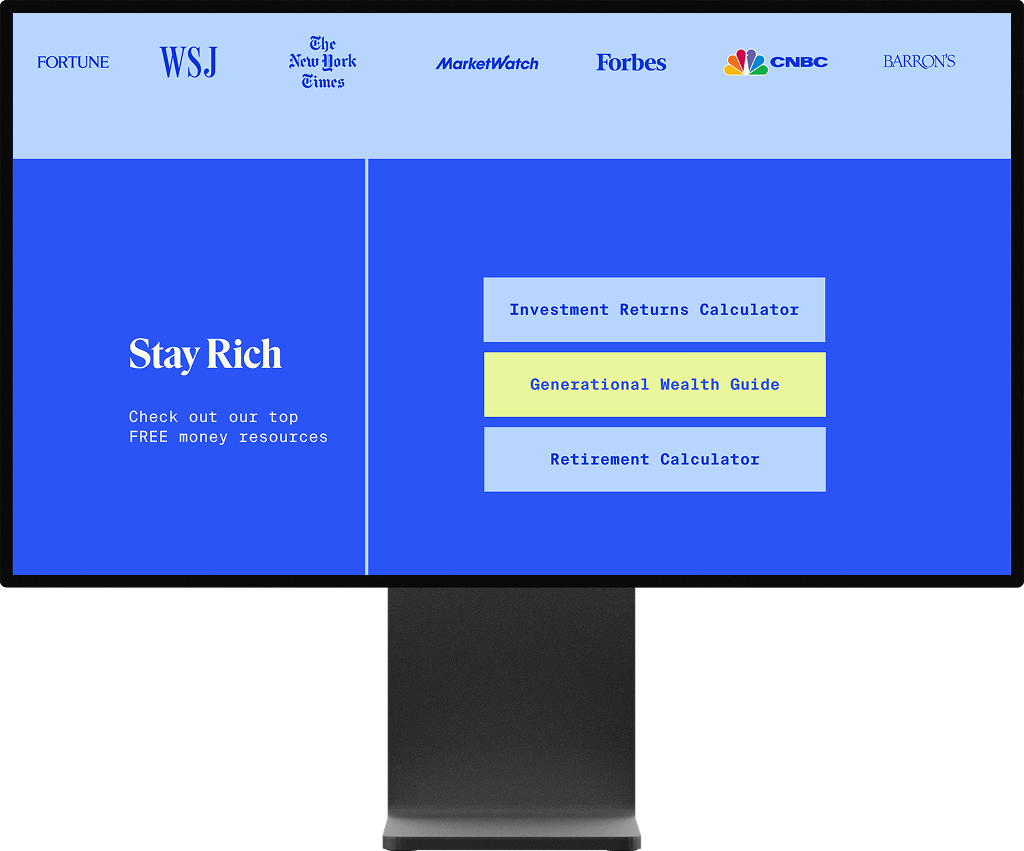
Moderate engagement: Many newsletter subscribers, but low site visits (e.g., 1-2 times). Popular tools: Retirement Calculator (10x), Investment Returns Calculator (8x), Generational Wealth Guide (7x).
Polls confirmed investing focus and top freebies for gating.

Pain Points:
Navigation overload leads to dropoff.
Lack of personalization around specific jobs (e.g., beginner investing vs. advanced wealth transfer).
Underpromotion of tools; need for tutorials (e.g., video guides).

Jobs to Be Done (JTBD)
Using the Jobs to Be Done framework, we reframed user needs around the progress they sought when "hiring" MDJ content and tools. JTBD statements were derived directly from interview themes, quotes, and poll data, focusing on context, motivation, and desired outcomes rather than demographics.

When I'm overwhelmed by investing jargon and scared to start, I want clear, beginner-friendly steps and relatable explanations, so I can confidently open my first brokerage account and begin building wealth without feeling stupid or intimidated. (Dominant job; ~35% poll priority on investing; echoed by beginners like Paola and Erica.)
When I'm paying down debt but want my money to grow, I want simple tools to track progress and baby-step investing advice, so I can escape debt faster while still saving and investing without derailing my budget. (Common among mid-tier users like Nicole and Amanda; debt + investing crossover frequent.)
When I'm debt-free or financially stable but unsure what comes next, I want advanced, nuanced strategies for generational wealth and optimized returns, so I can secure my family's future and overcome scarcity mindsets or risk aversion. (Prevalent for advanced users like Jessica V. and Shirly; 29% poll preference for Generational Wealth Guide.)
When my income is unpredictable or life feels expensive, I want automated budgeting hacks and realistic ways to make money work harder, so I can stop feeling behind my peers and gain control over my finances. (Recurring struggle; e.g., Laura B. on unpredictable income, Nicole on high costs.)
These JTBD statements guided prioritization: investing education and tools topped the list, with high demand for actionable resources that deliver emotional progress (confidence, security, empowerment).
"Mrs. Dow Jones’ Quizzes and Calculators are unique and helpful resources I couldn't find on Fidelity.com" — E. F.
Insights
Outcome Focus Drives Engagement: JTBD revealed users hire MDJ for emotional and functional progress (confidence, control, legacy), not just information—content should map directly to these jobs.
Relatability Builds Loyalty: Humor and empowerment drive retention, but irrelevance (e.g., mismatched jobs) causes disengagement.
Tools Drive Value: High-interest items like Index Funds List and Generational Wealth Guide align perfectly with top JTBDs and maximize signups when gated.
Emerging Needs: Relational finance (e.g., prenups, family discussions), international content, advanced topics (e.g., IPOs, mortgages).
Competitive Gaps: Simpler layouts (e.g., Her First 100k) with resource journeys outperform broad sites.
Recommendations & Strategy
Based on JTBD insights, we proposed a redesign focused on user outcomes:
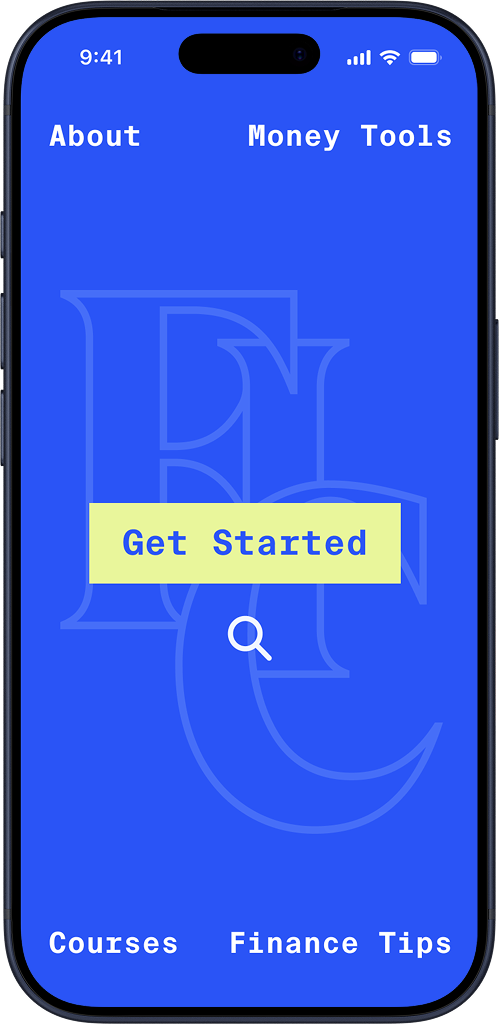
Navigation Redesign: Create a "Tools & Resources" page as a central hub, renaming "Freebies" for actionability. Guide users through job-aligned journeys (e.g., "Start Investing" → Index Funds List).
CTA Optimization: One primary CTA (e.g., "Subscribe for Tools") and three secondary (e.g., "Build Investing Confidence," "Secure Generational Wealth," "Automate My Budget").
Content Prioritization: Focus on investing (35% poll interest); gate top freebies (Index Funds List, Generational Wealth Guide) behind emails to drive signups aligned with core jobs.
Personalization Features: Implement job-based tracks (beginner investing vs. advanced wealth); add relational finance series (e.g., "Merging Finances Guide").
New Elements: Launch podcast with experts; add tool tutorials (videos); international adaptations.
Homepage Flow: Make it fluid and outcome-specific—e.g., hero section highlighting polls (77% feel "good with money" but seek investing progress).
Metrics for Success: Target 20-30% dropoff reduction, 15% signup increase; validate via A/B testing and usability sessions.
The Final Product
Post-research, MDJ implemented initial changes, resulting in a 25% uplift in tool downloads and newsletter growth.
This project demonstrated the power of mixed-methods research and JTBD in aligning digital experiences with real user progress. Key learnings: Early competitive analysis accelerates ideation; polling scales qualitative insights; JTBD shifts focus from "who" to "why," enabling more precise, outcome-driven design. For future work, incorporate longitudinal tracking to measure long-term engagement.
This case study showcases my ability to lead end-to-end research, translate data into actionable designs, and drive business outcomes in a fast-paced environment.