
InDex Planogram User Research
InDex Planogram User Research

User Research Initiative
Duration: June-October 2025
Role: Lead UX Researcher
Team: Lead UX Researcher partnering with Sales, Engineering, Marketing, and Product leadership
Tools Used: Zoom interviews, OtterAI (AI Note Taker), Google Sheets (notes), FigJam (affinity mapping), Powerpoint (executive presentation)
“Even we can see this planogram solution no longer works. We need to create something people will actually use, and something that makes our employees lives easier.”

The Wittern Group is a 90+ year-old leader in vending machine manufacturing, serving operators from small routes to large enterprises with brands like USI and IDS. InDEX was an outdated web-based planogram tool for creating and pushing product layouts to machines (only manually through a thumb-drive). Leadership wanted to modernize it by merging it with legacy systems into a user-friendly solution.
This was a hard-won initiative built on my prior Wittern project (where I was able to create measurable improvements based on user feedback), earning full executive buy-in and a contract extension. I spearheaded the research to define high-value planogram features, workflows, pain points, and integration needs—ultimately preventing investment in a standalone tool few would adopt and redirecting toward a smarter, integrated roadmap.
Problem Statement
The native InDEX software was bypassed by nearly all customers. Operators preferred competitors (Cantaloupe, iVend, Excel) for automation and ease. Key issues:
No active external users—only internal employees interacted recently.
Legacy tool felt clunky (unable to push remotely, needed manual entry, inconsistent execution, rigid templates).
The software was unreliable and user error was common without guardrails commonly leading to frustration and dropoff.
Risk: Building without clear user needs could waste resources on a low-adoption product.
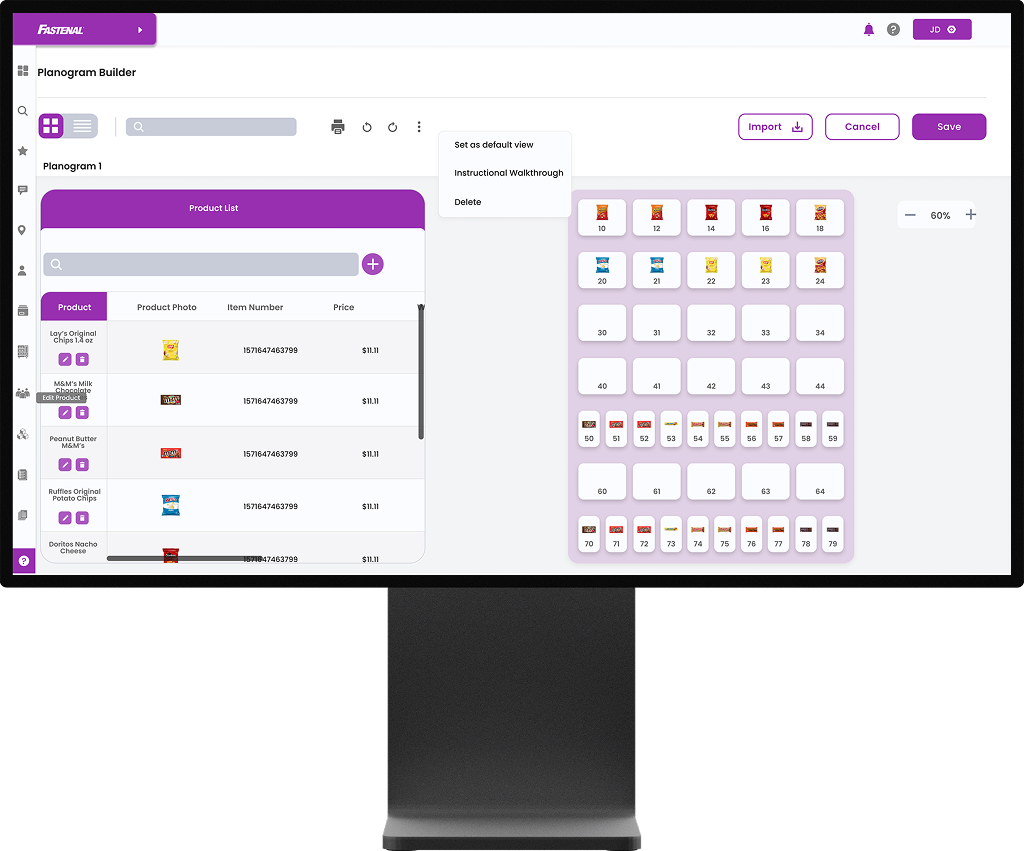
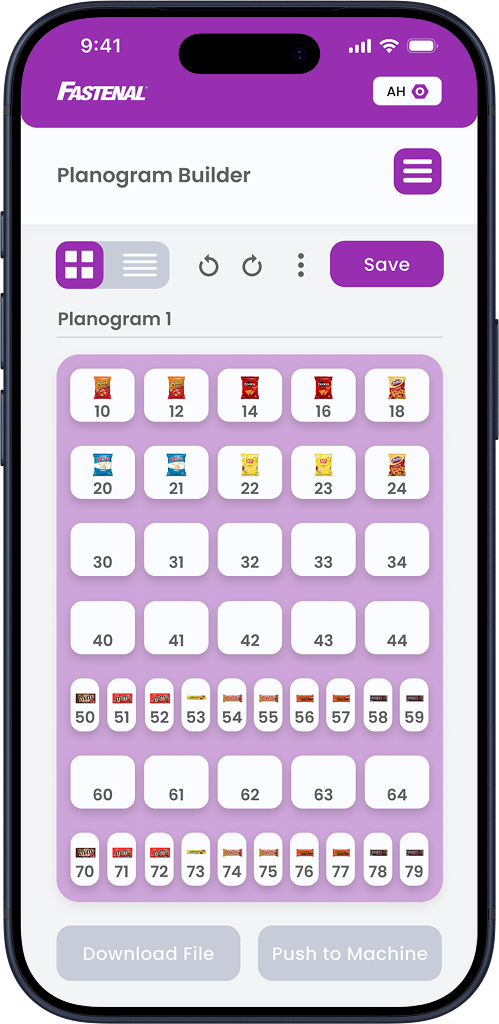
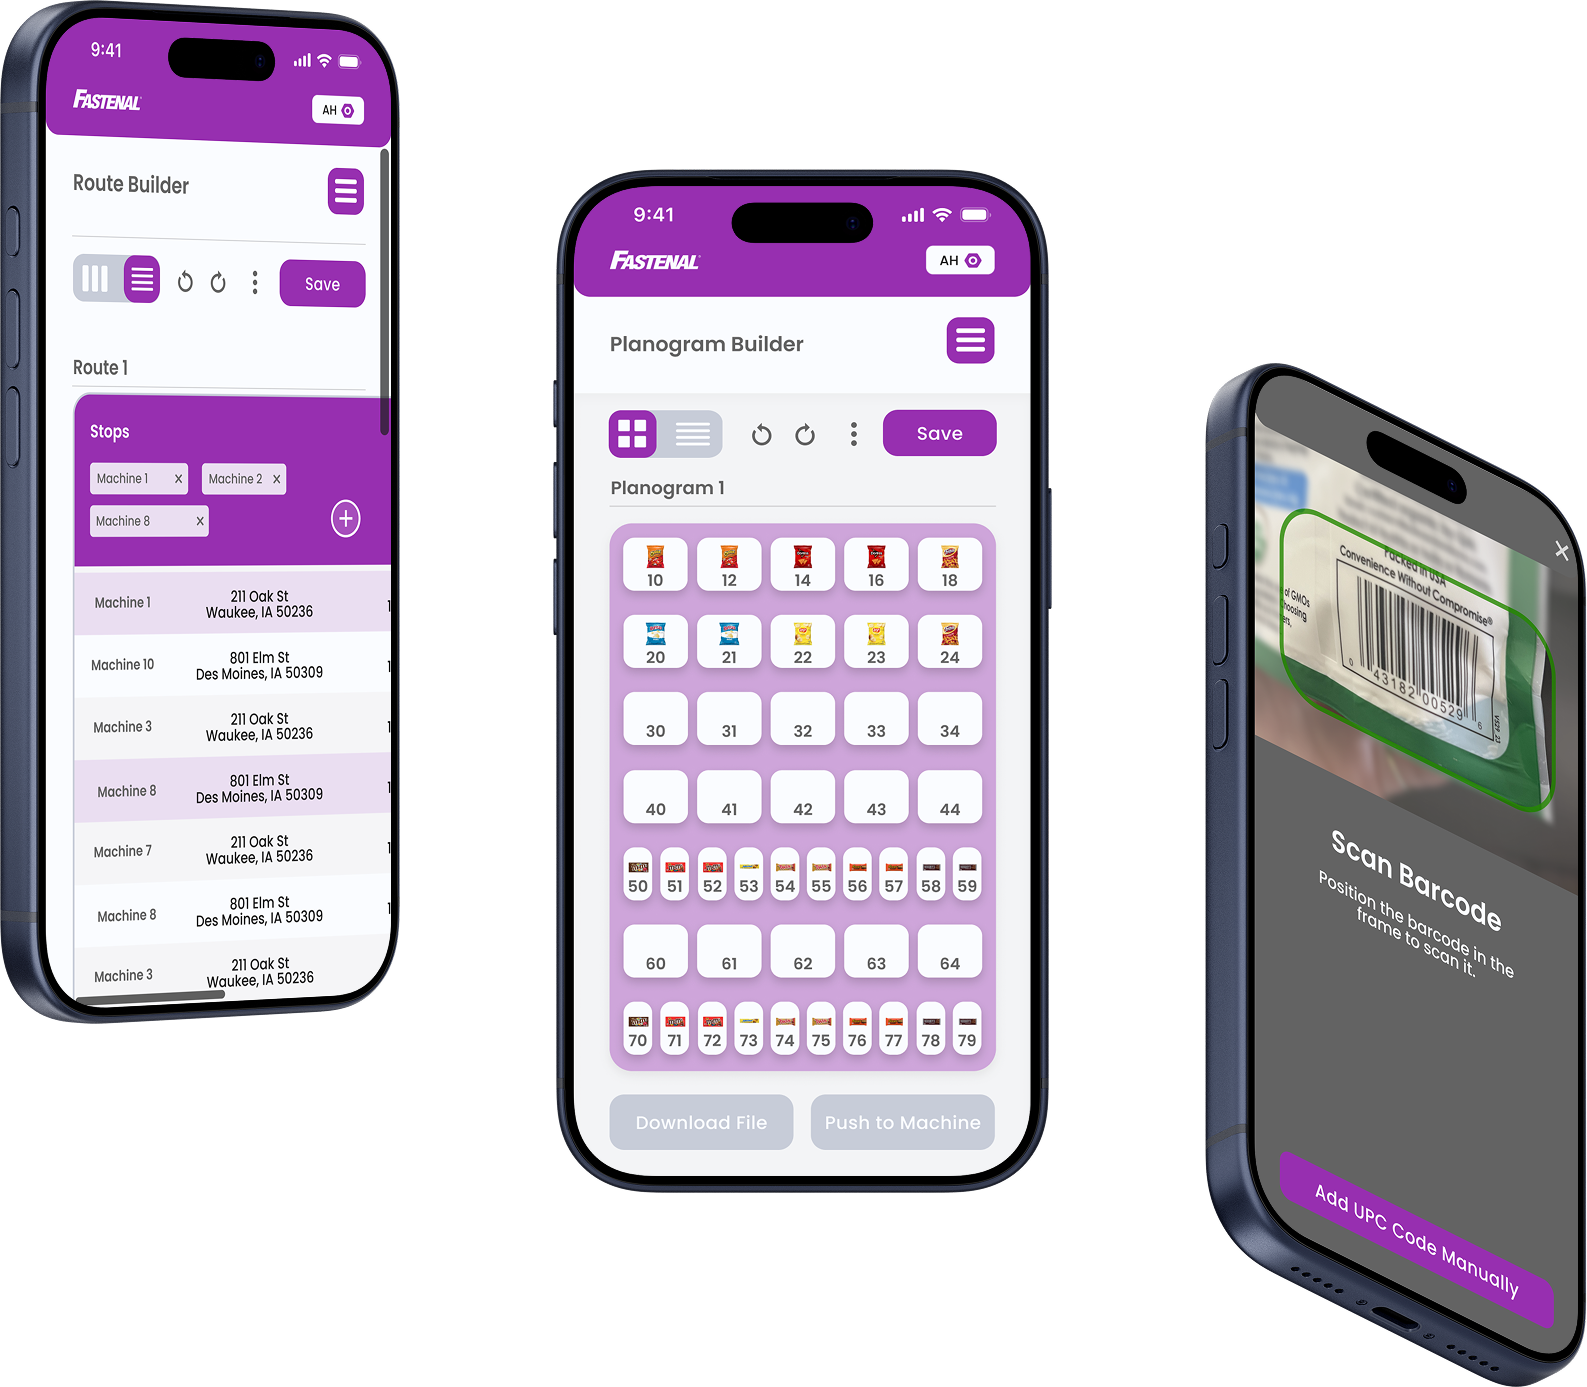
Introducing: the new InDex
This project involved comprehensive user research to inform a website to web app conversion and redesign, emphasizing seamless integration with existing VMS systems, mobile-first capabilities, and data-driven features that deliver real operator value. The outcome was a strategic pivot away from standalone development, a prioritized phased roadmap focused on small operations first, and prevention of wasted resources on a low-adoption product—while opening the door to a new snack vending segment and tiered freemium model.
Research Journey
Insight Goals
Map current planogram workflows, pain points, bright spots (across tools), and value drivers.
Identify most-used/valued features (templates, push, visuals, automation).
Understand migration barriers and triggers.
Segment needs by operation size.
Inform roadmap for refreshed InDEX focused on real user outcomes.

Methodology
I led the primary qualitative research component while participating in and contributing to the company's existing Voice of the Customer (VOC) initiative (a broader, ongoing program for gathering holistic customer input). This VOC effort ran in parallel to my interviews and helped contextualize findings with additional strategic customer perspectives.
Qualitative Research:
Interviews: 9 semi-structured Zoom sessions (30–60 min)
5 large operators (100–175,000 machines)
2 small operators
2 internal Wittern users (Engineer & Marketing—heavy InDEX users)
Sourcing Challenges: Recruiting was extremely difficult. I got creative and exhausted every channel—Sales, Marketing, multiple customer service teams (apparently none of them serviced this product with customers), and third-party partners—to secure participants. This highlighted a need to be more in touch with wider customer base. Sales provided large ops; small/mom-pop were nearly impossible to source (only 2 small committed; zero mom-pop; others ghosted).
Quantitative Research:
Competitive Analysis: Reviewed 8+ vending and store merchandising solutions (Cantaloupe, iVend, Plano Hero, OneDoor, Parlevel, etc.) to benchmark common practices. Key patterns: cloud-based access, mobile-first design, drag-and-drop + spreadsheet toggle views, AI-driven auto-creation, DEX/data integration, and real-time analytics. Success looked like instant creation/application, field access, and data-backed merchandising that drives sales/efficiency. This revealed vending-specific gaps (most tools were retail-focused) and highlighted what users value in competitors.
Jobs to Be Done (JTBD)
Using the Jobs to Be Done framework, we reframed user needs around the progress they sought when "hiring" a planogram solution. JTBD statements were derived directly from interview themes, quotes, and poll data, focusing on context, motivation, and desired outcomes rather than demographics.
When I have multiple machines and product changes across locations, I want to create, edit, and push planograms quickly and reliably from my computer, phone or tablet, so I can keep machines fresh, maintain variety, drive repeat visits, and maximize sales without spending hours in the office or driving to each location.
(Supported by: small and large operators' daily/weekly updates, mobile-first emphasis, push failures as top pain, "variety as sales tactic")
When I'm servicing a machine on-site and need to make a quick adjustment (e.g., swap a slow mover or react to stock issues), I want to pull up the exact planogram instantly and edit it in the field, so I can fix problems immediately, reduce downtime, and avoid returning later.
(Supported by: on-the-fly needs, QR code suggestion, mobile push priority, operators changing items during restocking,
When I manage a mix of machine types (vending, kiosks, micro-markets) and locations (schools, hotels, offices), I want flexible, reusable templates that adapt automatically or with minimal rework, so I can avoid rebuilding everything from scratch and save massive time across my fleet.
(Supported by: rigid templates as major pain, "templates useless for variety of machines," need for automatic template creation based on DEX data from machine.)
When I'm creating a planogram I both want it to be easy to build and simple to communicate to operators or new staff when training. I want both a spreadsheet build and clear visual planograms with accurate product images and easy sharing, so everyone understands the setup quickly, reduces mistakes, and maintains consistent merchandising across the team, while also being able to utilize spreadsheet shortcuts.
(Supported by: pictures as vital communication tool, visual vs. spreadsheet toggle, drag-and-drop + visuals, majority of interviewees, competitive bright spots)
These statements guided prioritization: mobile push and integration, automated template creation, and the ability to toggle between drag-and -drop and spreadsheet planogram creation rose to the top because they directly address high-frequency, high-impact jobs with planogramming specifically.
Key Findings
Core Insights
Our biggest learning: Planogramming has no standalone value—value emerges when integrated with inventory, dynamic scheduling, alerts, and route planning. Isolated tool = bypass. This turned the initiative on it’s head.
We quickly learned that based on feedback from users and JTBD that there is space in the market for an excellent, vending specific planogram solution, but if we didn’t combine it with other features that have immediate value to the customer, they would not be willing to pay for it. It needed to be part of a larger VMS to sell.
We also found that not a single customer we could find had ever used InDEX, so we quickly pivoted to gauging their feedback on their current VMS and Planogramming solution as well as any they had used in the past.

Operator Behavior
Vending owners/operators are highly pragmatic and not loyal to any VMS. They switch quickly to whichever solution delivers the best results (sales lift, efficiency, reduced errors). This low loyalty creates significant marketplace opportunity for a well-executed, vending-specific solution.
We also learned that all current solutions feel as if they were “designed outside the industry” and are not vending specific, creating an opportunity for differentiation.
Pain Points (From Competitiors)
Clunky, unreliable (push failures, manual entry, no custom templates).
Overwhelming global product lists; obsolete items unhideable without tax issues.
No mobile-first or on-the-fly edits.
Rigid templates useless for varied machines.
"Feels designed outside the industry" (manual, non-vending-specific).

Size Differentiations
Large: Bulk push, AI suggestions, data-driven automation.
Small: Simplicity, mobile access, quick edits.
Mom-pop: Unreachable, likely are not connected to the internet, prioritize ease, and do not necessitate remote push due to one to few machines.

Outcome:
Research surfaced strategic questions > tactical answers (e.g., "Who are we building for?"). Prevented misaligned development.
Bright Spots (From Competitors):
Spreadsheet view in addition to visual layout (Excel-like shortcuts).
Auto-templates from DEX data.
Mobile/digital push.
Alerts straight to desktop or mobile.
Centralized control across machine types.

Migration Drivers
Better integration/automation.
Nimble feature updates.
Clear ROI (sales lift, efficiency).
Vending specific
"The software I use pulls the DEX data from each machine to build the layout for the planogram... it never has any issues being pushed to the machine... It is very smart." — VP Prestige Solutions.
Insights
Integration is essential — Standalone planogramming fails; embed in full VMS.
Market Opportunity — Operators' low loyalty to VMS creates high potential for a superior, vending-specific solution.
Start narrow — Small ops for quick adoption, then scale features for large.
Onboarding barrier — No active users → no feedback loop. Need strong value prop to migrate.
Resource win — Research avoided sunk costs, redirected strategy.
Recommendations & Roadmap
The research triggered a major pivot: Abandon standalone InDEX refresh. Instead, integrate planogramming into an existing legacy VMS (IQ Tech) already used by a large segment of users.
This VMS was previously limited to medical/industrial clients. With the pivot, it opened to snack vending operators—a new segment. Existing features (alerts, inventory) would be offered in tiered plans (free, paid, top-tier). My follow-up work focused on:
Defining tiered value: Create a free version with enough core value (e.g., basic planogram creation, mobile push, simple templates) to hook users and encourage discovery/graduation to paid tiers (advanced automation, AI suggestions, bulk push, dynamic scheduling).
Prioritized phased approach starting with small operations:
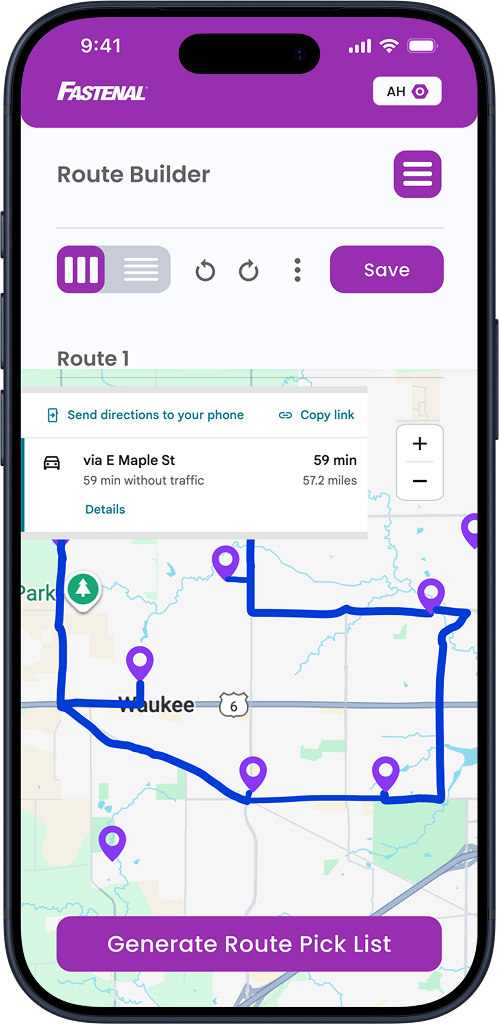
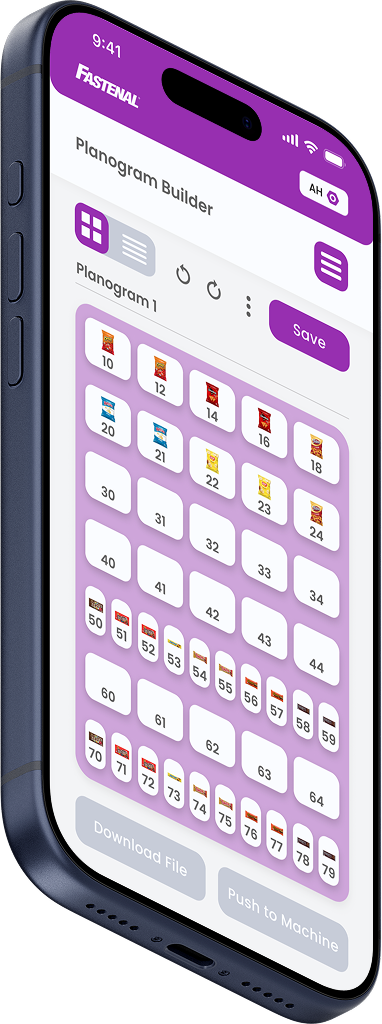
Priority 1: MVP
Mobile-first interface + digital push-to-machine
QR code scan for on-site edits
Automated new product add (barcode scan)
Editable/automated templates (DEX-sourced)
Centralized control across machine types
Ability to self register (was complicated up until now)
Priority 2: Nice to Have
Guided data sync ("Seed Sync" style migration)
Toggle spreadsheet/visual builder
Priority 3: Surprise & Delight
Photo/AI planogram update
Priority 4: Later
Full AI automation (par levels, promotions, recs)
The Final Product
Business Impact: Halted ineffective standalone development → saved time/money. Redirected to integration into existing VMS + new snack vending segment. Positioned product for higher adoption via tiered freemium model.
Personal Impact: Demonstrated ability to lead research in ambiguous/enterprise environments, creatively overcome sourcing barriers, influence strategic pivots, and deliver actionable value that extended my contract.
Key Learnings: Operator pragmatism/low loyalty = opportunity. Creative, multi-channel recruiting is essential in B2B. Research can (and should) kill bad ideas and redirect to higher-impact paths. Holistic view (user + business + segment) drives better outcomes.